指标监控
在微服务治理中,服务监控也是非常重要的一个环节,监控一个服务是否正常工作,需要从多维度进行,如:
- mysql指标
- mongo指标
- redis指标
- 请求日志
- 服务指标统计
- 服务健康检测 ...
监控的工作非常大,本节仅以其中的服务指标监控作为例子进行说明。
基于prometheus的微服务指标监控
服务上线后我们往往需要对服务进行监控,以便能及早发现问题并做针对性的优化,监控又可分为多种形式,比如日志监控,调用链监控,指标监控等等。而通过指标监控能清晰的观察出服务指标的变化趋势,了解服务的运行状态,对于保证服务稳定起着非常重要的作用 prometheus是一个开源的系统监控和告警工具,支持强大的查询语言PromQL允许用户实时选择和汇聚时间序列数据,时间序列数据是服务端通过HTTP协议主动拉取获得,也可以通过中间网关来推送时间序列数据,可以通过静态配置文件或服务发现来获取监控目标
监控接入
go-zero 框架中集成了基于 prometheus 的服务指标监控。但是没有显式打开,需要开发者在 config.yaml 中配置:
Prometheus:
  Host: 127.0.0.1
  Port: 9091
  Path: /metrics
如果开发者是在本地搭建 Prometheus,需要在 Prometheus 的配置文件 prometheus.yaml 中写入需要收集服务监控信息的配置:
- job_name: 'file_ds'
    static_configs:
      - targets: ['your-local-ip:9091']
        labels:
          job: activeuser
          app: activeuser-api
          env: dev
          instance: your-local-ip:service-port
因为本地是用 docker 运行的。将 prometheus.yaml 放置在 docker-prometheus 目录下:
docker run \
    -p 9090:9090 \
    -v dockeryml/docker-prometheus:/etc/prometheus \
    prom/prometheus
打开 localhost:9090 就可以看到:
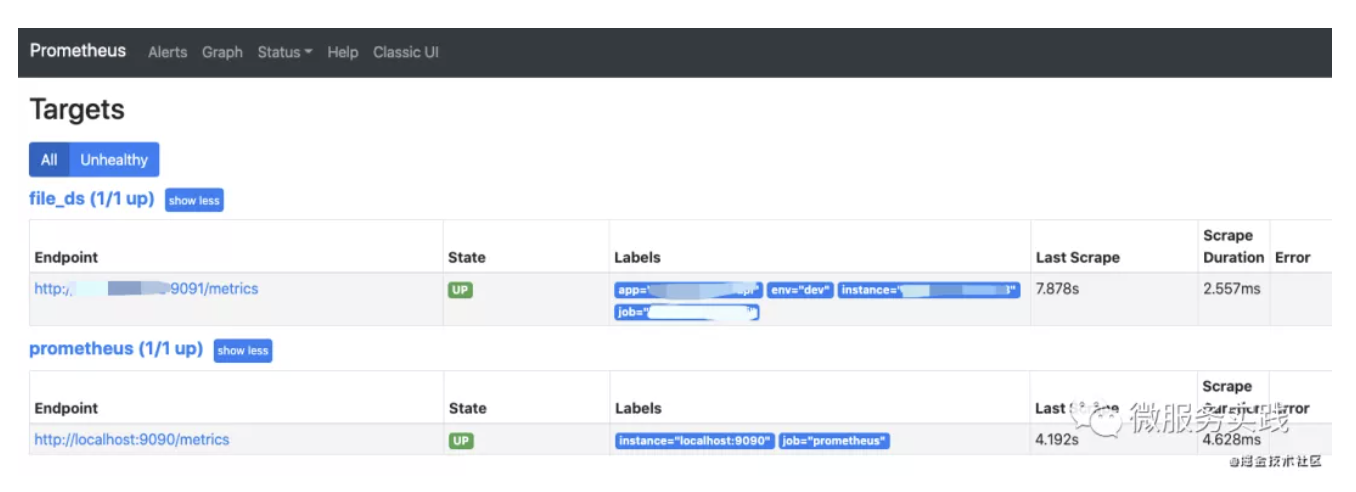
点击 http://service-ip:9091/metrics 就可以看到该服务的监控信息:
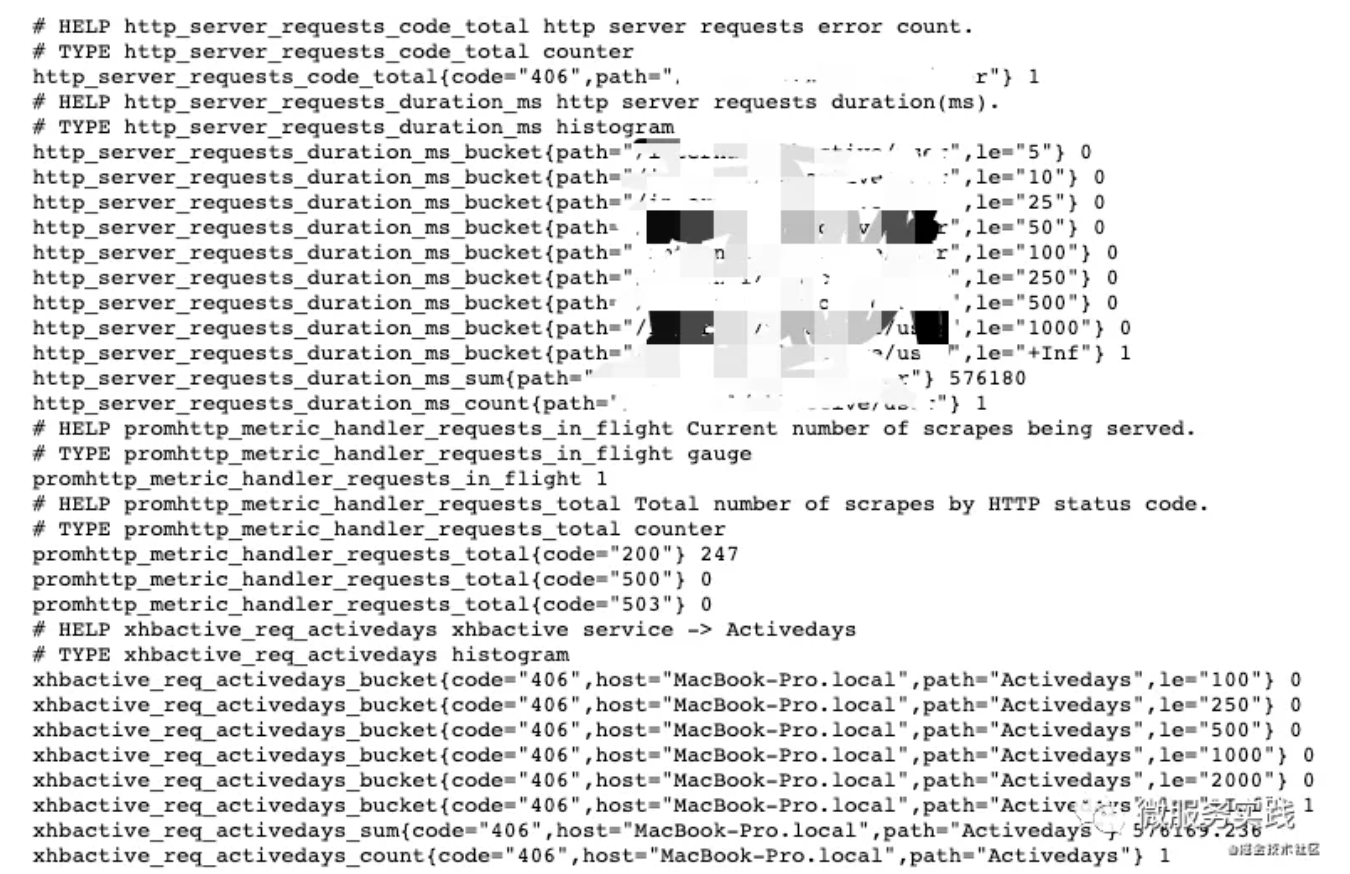
上图我们可以看出有两种 bucket,以及 count/sum 指标。
那 go-zero 是如何集成监控指标?监控的又是什么指标?我们如何定义我们自己的指标?下面就来解释这些问题
如何集成
上面例子中的请求方式是 HTTP,也就是在请求服务端时,监控指标数据不断被搜集。很容易想到是 中间件 的功能,具体代码:
var (
 metricServerReqDur = metric.NewHistogramVec(&metric.HistogramVecOpts{
  ...
    // 监控指标
  Labels:    []string{"path"},
    // 直方图分布中,统计的桶
  Buckets:   []float64{5, 10, 25, 50, 100, 250, 500, 1000},
 })

 metricServerReqCodeTotal = metric.NewCounterVec(&metric.CounterVecOpts{
  ...
    // 监控指标:直接在记录指标 incr() 即可
  Labels:    []string{"path", "code"},
 })
)

func PromethousHandler(path string) func(http.Handler) http.Handler {
 return func(next http.Handler) http.Handler {
  return http.HandlerFunc(func(w http.ResponseWriter, r *http.Request) {
      // 请求进入的时间
   startTime := timex.Now()
   cw := &security.WithCodeResponseWriter{Writer: w}
   defer func() {
        // 请求返回的时间
    metricServerReqDur.Observe(int64(timex.Since(startTime)/time.Millisecond), path)
    metricServerReqCodeTotal.Inc(path, strconv.Itoa(cw.Code))
   }()
   // 中间件放行,执行完后续中间件和业务逻辑。重新回到这,做一个完整请求的指标上报
      // [🧅:洋葱模型]
   next.ServeHTTP(cw, r)
  })
 }
}
其实整个很简单:
- HistogramVec 负责请求耗时搜集:
- bucket 存放的就是 option 指定的耗时指标。某个请求耗时多少就会被聚集对应的桶,计数。
- 最终展示的就是一个路由在不同耗时的分布,很直观提供给开发者可以优化的区域。
- CounterVec 负责指定 labels 标签搜集:
- Labels: []string{"path", "code"}
- labels 相当一个 tuple。go-zero 是以(path, code)作为整体,记录不同路由不同状态码的返回次数。如果 4xx,5xx过多的时候,是不是应该看看你的服务健康程度?
如何自定义
go-zero 中也提供了 prometheus metric 基本封装,供开发者自己开发自己 prometheus 中间件。
| 名称 | 用途 | 搜集函数 |
|---|---|---|
| CounterVec | 单一的计数。用作:QPS统计 | CounterVec.Inc() 指标+1 |
| GuageVec | 单纯指标记录。适用于磁盘容量,CPU/Mem使用率(可增加可减少) | GuageVec.Inc()/GuageVec.Add() 指标+1/指标加N,也可以为负数 |
| HistogramVec | 反应数值的分布情况。适用于:请求耗时、响应大小 | HistogramVec.Observe(val, labels) 记录指标当前对应值,并找到值所在的桶,+1 |
另外对 HistogramVec.Observe() 做一个基本分析:
我们其实可以看到上图每个 HistogramVec 统计都会有3个序列出现:
- _count:数据个数
- _sum:全部数据加和
- _bucket{le=a1}:处于 [-inf, a1] 的数据个数
所以我们也猜测在统计过程中,分3种数据进行统计:
// 基本上在prometheus的统计都是使用 atomic CAS 方式进行计数的
// 性能要比使用 Mutex 要高
func (h *histogram) observe(v float64, bucket int) {
 n := atomic.AddUint64(&h.countAndHotIdx, 1)
 hotCounts := h.counts[n>>63]

 if bucket < len(h.upperBounds) {
    // val 对应数据桶 +1
  atomic.AddUint64(&hotCounts.buckets[bucket], 1)
 }
 for {
  oldBits := atomic.LoadUint64(&hotCounts.sumBits)
  newBits := math.Float64bits(math.Float64frombits(oldBits) + v)
    // sum指标数值 +v(毕竟是总数sum)
  if atomic.CompareAndSwapUint64(&hotCounts.sumBits, oldBits, newBits) {
   break
  }
 }
 // count 统计 +1
 atomic.AddUint64(&hotCounts.count, 1)
}
所以开发者想定义自己的监控指标:
- 在使用 goctl 生成API代码指定要生成的 中间件:https://zeromicro.github.io/go-zero/middleware.html
- 在中间件文件书写自己需要统计的指标逻辑
- 当然,开发者也可以在业务逻辑中书写统计的指标逻辑。同上。
上述都是针对 HTTP 部分逻辑的解析,RPC 部分的逻辑类似,你可以在 拦截器 部分看到设计。
grafana可视化界面
grafana是一款可视化工具,功能强大,支持多种数据来源Prometheus、Elasticsearch、Graphite等,安装比较简单请参考官方文档,grafana默认端口3000,安装好后再浏览器输入http://localhost:3000/,默认账号和密码都为admin
下面演示如何基于以上指标进行可视化界面的绘制:
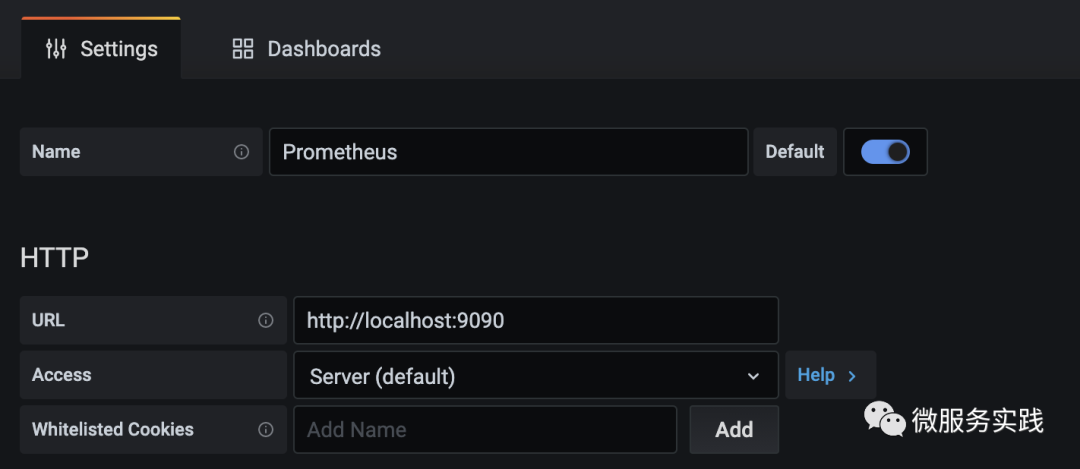
点击左侧边栏Configuration->Data Source->Add data source进行数据源添加,其中HTTP的URL为数据源的地址
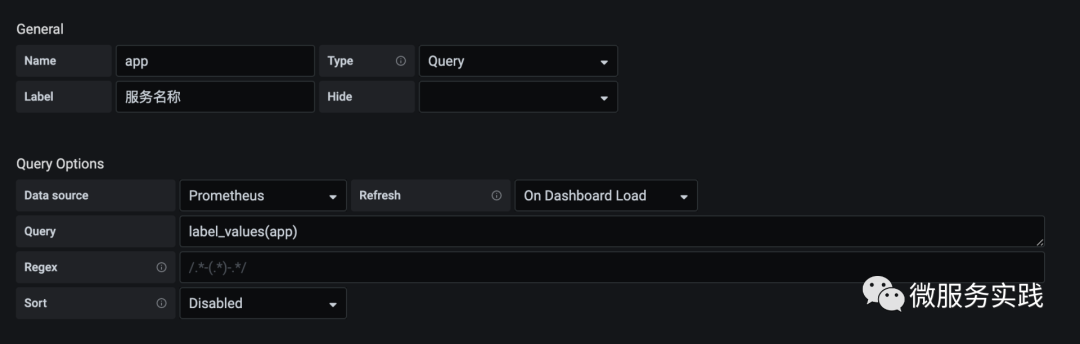
点击左侧边栏添加dashboard,然后添加Variables方便针对不同的标签进行过滤筛选比如添加app变量用来过滤不同的服务
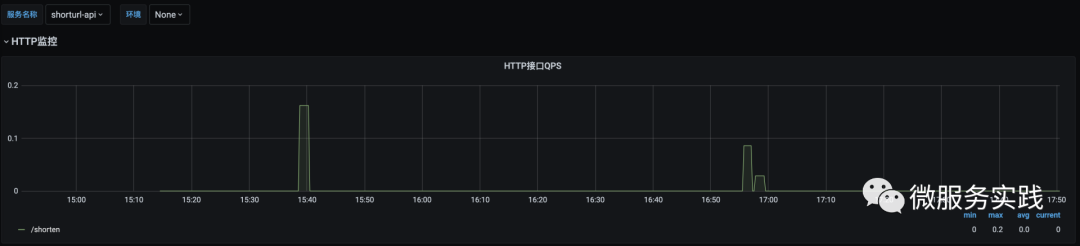
进入dashboard点击右上角Add panel添加面板,以path维度统计接口的qps
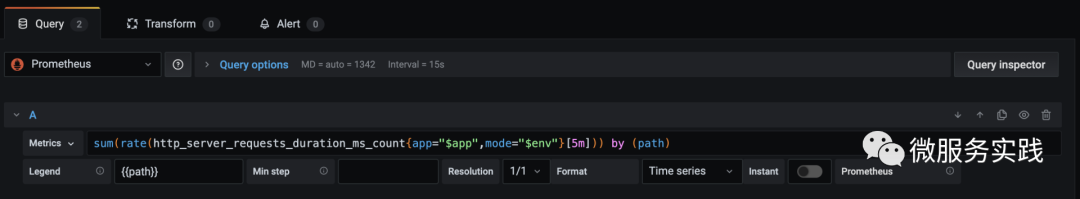
最终的效果如下所示,可以通过服务名称过滤不同的服务,面板展示了path为/shorten的qps变化趋势